Understanding Output Results
tRAX generates data in multiple formats (including text files and images) at each stage of the analysis so that researchers can study the experimental results comprehensively. The main results can be divided into the following categories:
- Quality assessment
- Read alignments and summary statistics
- tRNA and tDR read classification and normalization
- Read coverage statistics
- Abundance of tRNA, tDRs, and other genes
- Differential expression comparison
- Base mismatch estimation
- Genome browser tracks
The complete list of output files and structure can be found in the reference manual. For details of the analysis methods used in tRAX, please refer to the Methods section of our publication.
Quality assessment
tRAX generates a quality assessment report (<experiment name>-qa.html) in HTML format to provide researchers with an estimate on the “quality of data” and possible diagnostic information when issues occur. In brief, the report contains the percentage of reads retained after adapter removal, read mapping rate, proportion of reads mapped to tRNAs versus rRNAs and unannotated regions, percentage of expected read lengths, and range of read count normalization size factors across samples.
Twelve quality metrics are included to determine the data quality at different processing stages.
| Category | Quality definition |
|---|---|
| Sequencing read filtering/merging rate (percentage of sequencing reads retained for read mapping) | Pass: >=60%; Warning: < 60% and >= 20%; Fail: < 20% |
| Number of mappable reads | Pass: >= 200,000; Warning: < 200,000 |
| Read mapping rate | Pass: >= 65%; Warning: < 65% |
| Distribution of reads mapped to tRNAs | Pass: >= 50%; Warning: < 50% |
| Distribution of reads mapped to rRNAs | Pass: <= 35%; Warning: > 35% |
| Distribution of reads mapped to unannotated regions | Pass: <= 35%; Warning: > 35% |
Optimal average read length when using non-fragment mode (--nofrag) |
Pass: <= 75 nt; Warning: > 75 nt |
| Optimal average read length when using fragment mode | Pass: <= 40 nt; Warning: > 40 nt |
Read length range between 40 and 75 nt when using non-fragment mode (--nofrag) |
Pass: >= 70%; Warning: < 70% |
| Read length range between 15 and 50 nt when using fragment mode | Pass: >= 70%; Warning: < 70% |
| Percentage of tRNAs having at least 20 mapped reads | Pass: >= 50%; Warning: < 50% |
| DESeq2 normalization size factor differences across samples | Pass: < 3X; Warning: > 3X |
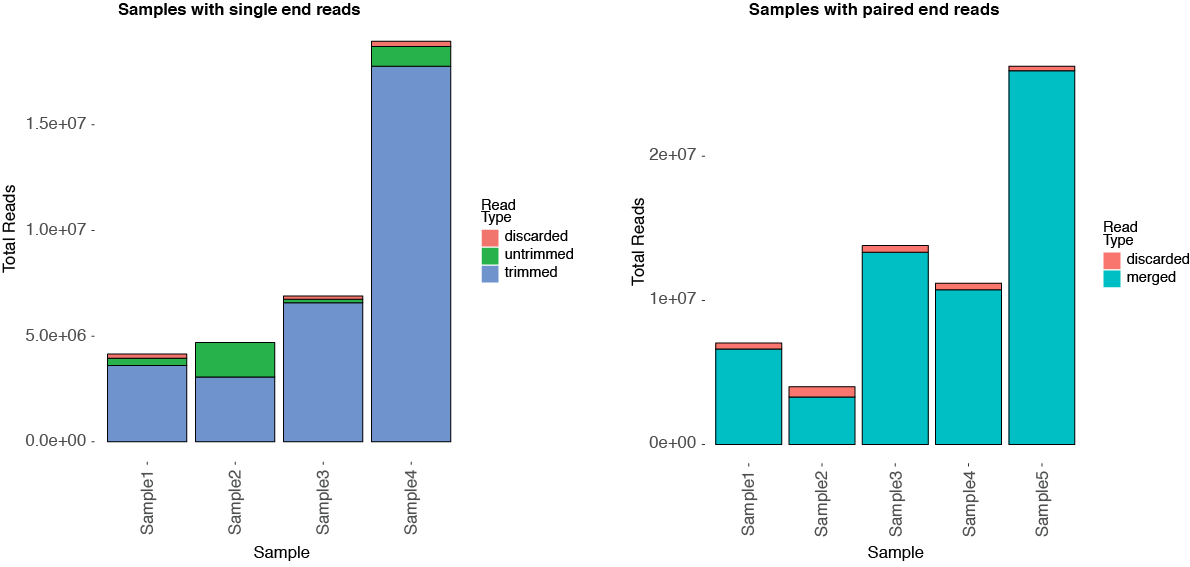
To accompany the report, trimadapters.py in tRAX produces a chart (runname_ca.pdf for single end reads or runname_sp.pdf for paired end reads) to show the adapter trimming rate for single end reads or read end merging rate for paired end reads. This is also equivalent to the percentage of reads used for read alignments. Below are two examples illustrating the data.
Read alignments and summary statistics
Upon completion of aligning sequencing reads to the reference database, tRAX generates a sorted BAM file (<sample>.bam) with index (<sample>.bam.bai) for each sample that will be used for transcript abundance estimation. Researchers who would like to study the data in more details can also utilize tools like Integrative Genomics Viewer to visualize the read alignments. If --makehub option is used with processsamples.py to generate genome browser tracks, an additional BAM file (<sample>-genome.bam) with genomic coordinates instead of transcript coordinates will be created.
To provide a summary of the read mapping statistics, a tab-delimited text file (<experiment name>-mapinfo.txt) is generated with the number of uniquely mapped reads, the number of multi-mapped reads, and the number of unmapped reads for each sample. A histogram (<experiment name>-mapinfo.pdf) with the corresponding mapping statistics is also provided as the following example for visualization. The uniquely mapped and multi-mapped reads will be used for computing transcript abundance while the unmapped reads will be discarded. An excess of unmapped reads may suggest contamination in the sequencing data such as adapter sequences or sequences from other sources.
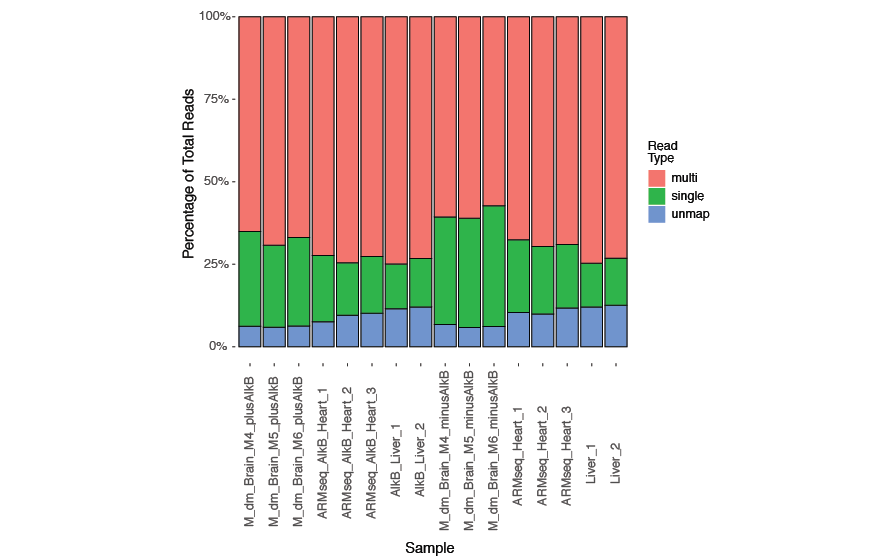
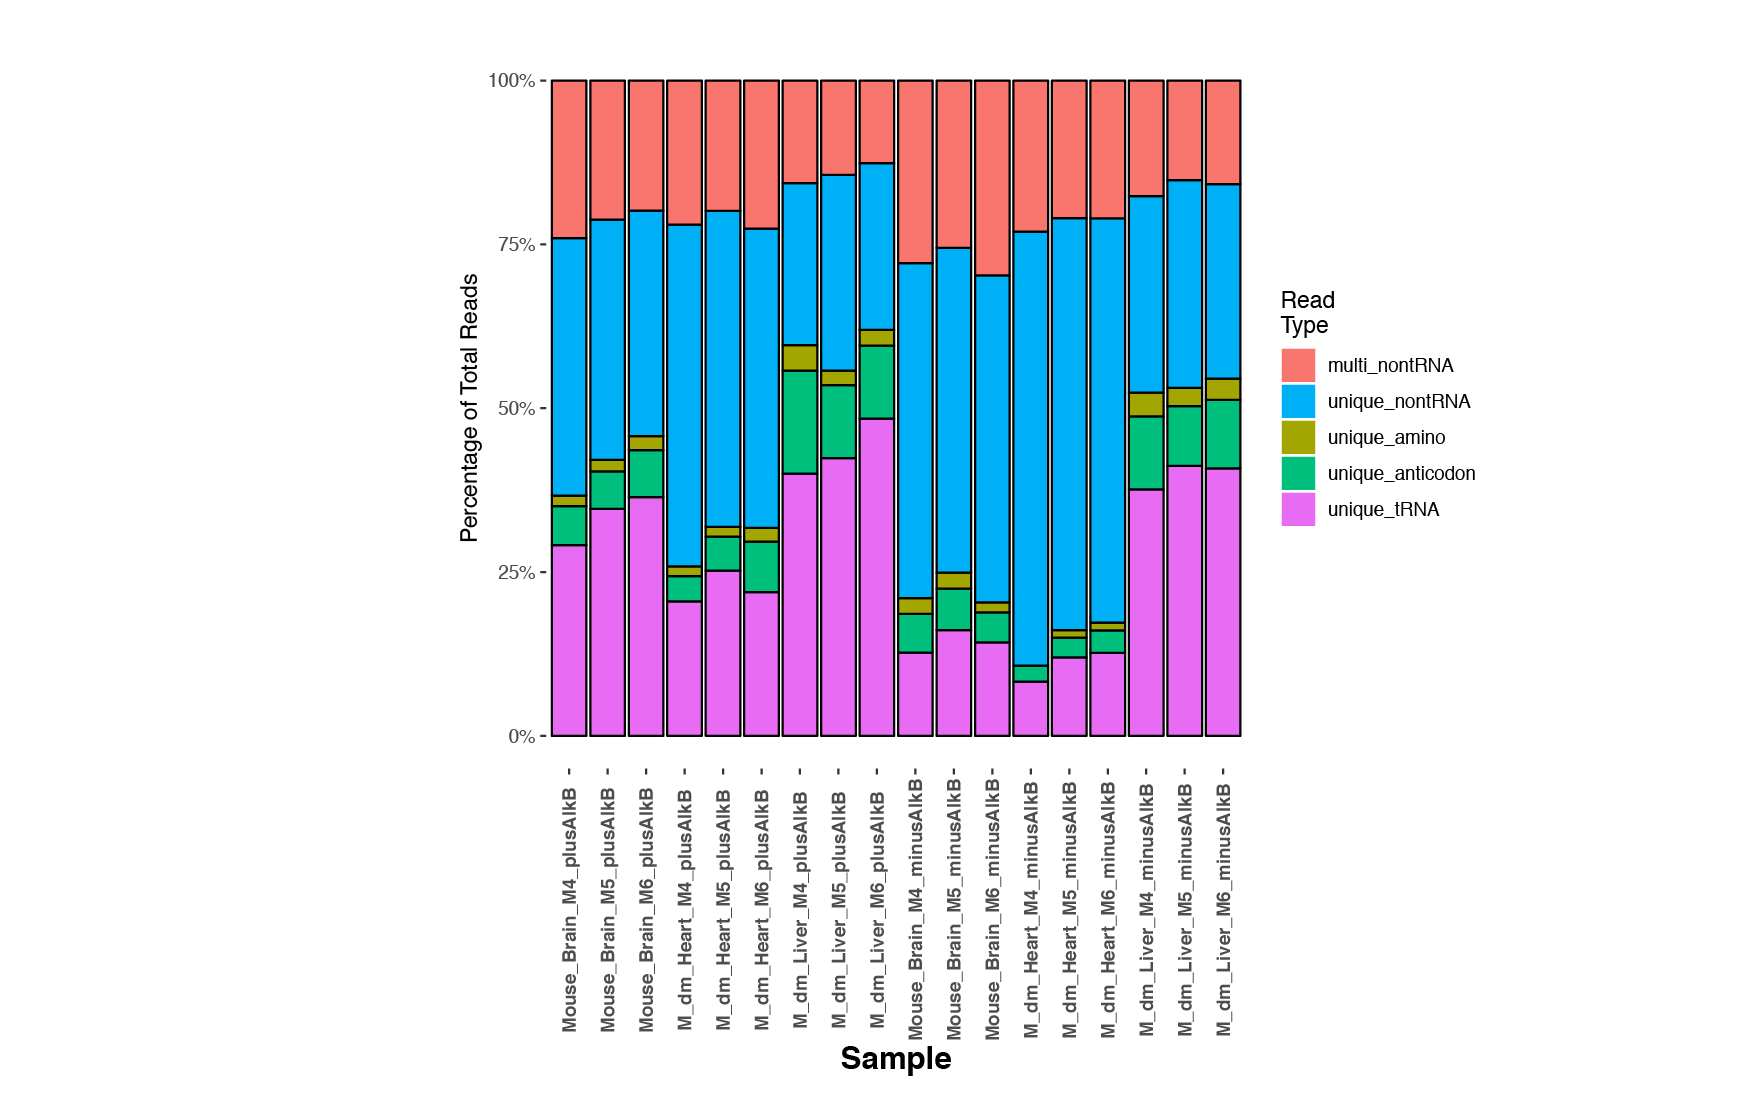
In addition, another histogram (<experiment name>-trnamapinfo.pdf) is provided to show the uniqueness of read mappability for tRNAs and other ncRNAs as below. Reads uniquely mapped to tRNA transcripts and other ncRNAs are categorized as "unique_tRNA" and "unique_nontRNA" respectively while reads mapped to multiple non-tRNA transcripts are marked as "multi_nontRNA". Reads mapped to multiple tRNA transcripts are further distinguished between "unique_anticodon" (equal matches to multiple different tRNAs with the same anticodon) and "unique_amino" (equal matches to tRNAs decoding the same amino acid).
tRNA and tDR read classification and normalization
In eukaryotic genomes, many tRNAs have multiple identical gene copies. When a sequencing read aligns to a tRNA transcript that has multiple identical gene copies, the corresponding gene locus usually cannot be determined. Therefore, in tRAX, sequencing reads that align to the mature tRNAs are considered as "transcript" reads and are counted in the form of tRNA transcript such as "tRNA-Glu-TTC-1". Those that align to tRNA gene loci with flanking sequences are considered as pre-tRNA reads and are counted in the form of tRNA genes such as "tRNA-Glu-TTC-1-1". tRAX separates the read coverage (described below) of transcript reads and pre-tRNA reads into different sets of output files.
For analyzing tRNA-derived small RNAs (tDRs), tRAX groups the sequencing reads into different tRNA fragment types.
- Whole tRNAs: reads that are within 10 bases of the start and end of the full tRNA sequence
- 5' fragments: reads that are within 10 bases of the start position, but do not reach the end of the tRNA sequence
- 3' fragments: reads that are within 10 bases of the end position, but do not reach the start position of the tRNA sequence
- Other fragments: reads that do not fit any of the above categories
The tRNA fragment types are used to perform read counting and distribution computation. If non-fragmentation mode (--nofrag) is used when running processsamples.py, tRNAs will not be seperated into fragment types and all read counts will be computed against the corresponding tRNA. tRAX normalizes raw read counts using DESeq2 "size factors" which can be found in <experiment name>-SizeFactors.txt.
Read coverage statistics
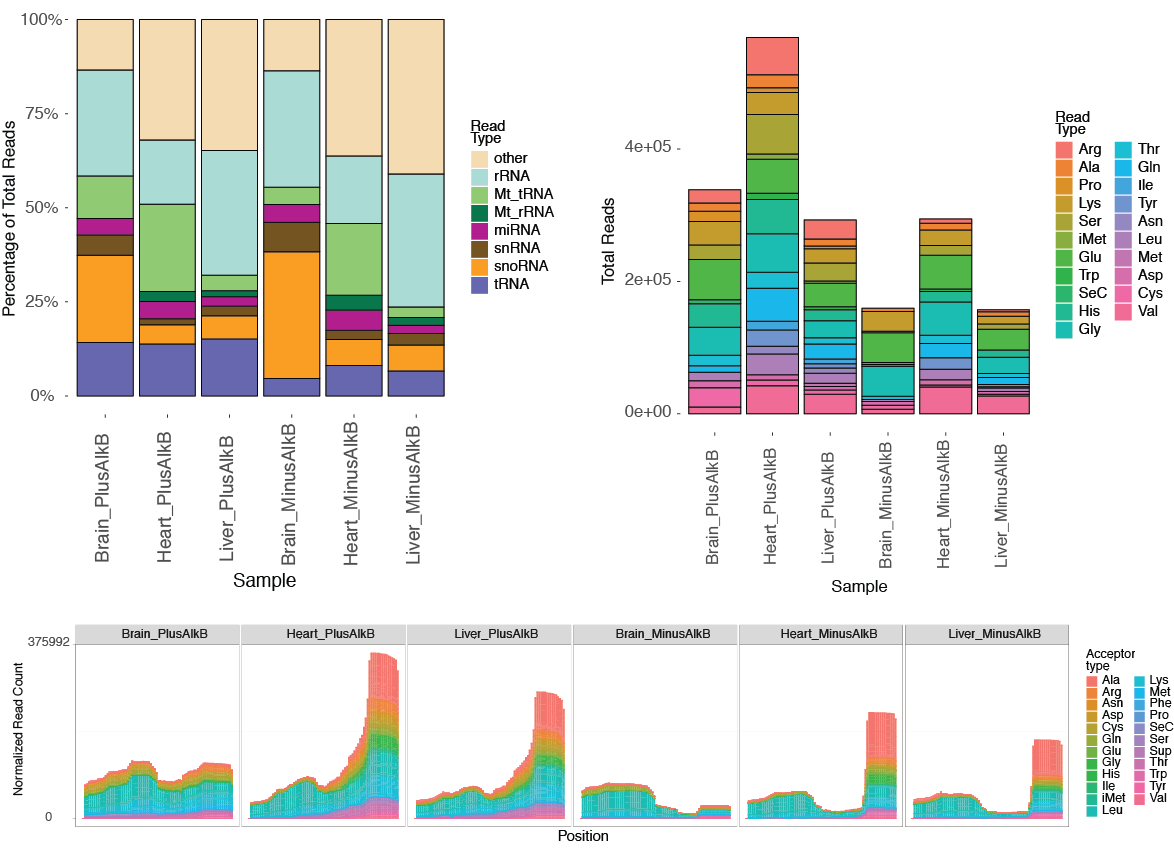
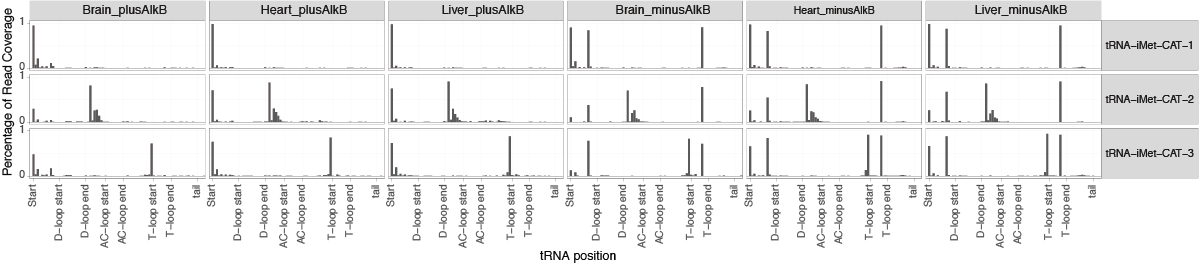
Read distributions of detected small RNA types and tRNA isotypes in different samples are summarized in multiple charts with corresponding tab-delimited text file containing the data source. <experiment name>-typecounts.pdf (left below) shows the read distribution across different gene types corresponding to the tRNAs, non-coding RNA annotations provided in Ensembl GTF file, and user-supplied BED files of other gene annotations. "Other" genes in the chart represents sequencing reads that are not mapped to any annotated gene features. <experiment name>-aminocounts.pdf (right below) shows the read distribution of tRNA isotypes. This may enable determination of the dominant tRNA isotypes in the samples. Another way to visualize it is through the summary read coverage plot by tRNA positions <experiment name>-combinedcoverage.pdf (bottom below). This plot is especially useful for assessing the overall distribution of different tRNA fragment types (for example, 5' fragments vs 3' fragments). Read coverage is also extended to the upstream and downstream regions of tRNAs in the pre-tRNA plot <experiment name>-pretRNAcombinedcoverage.pdf for examining those tDRs that include 5' leader of 3' trailer sequence.
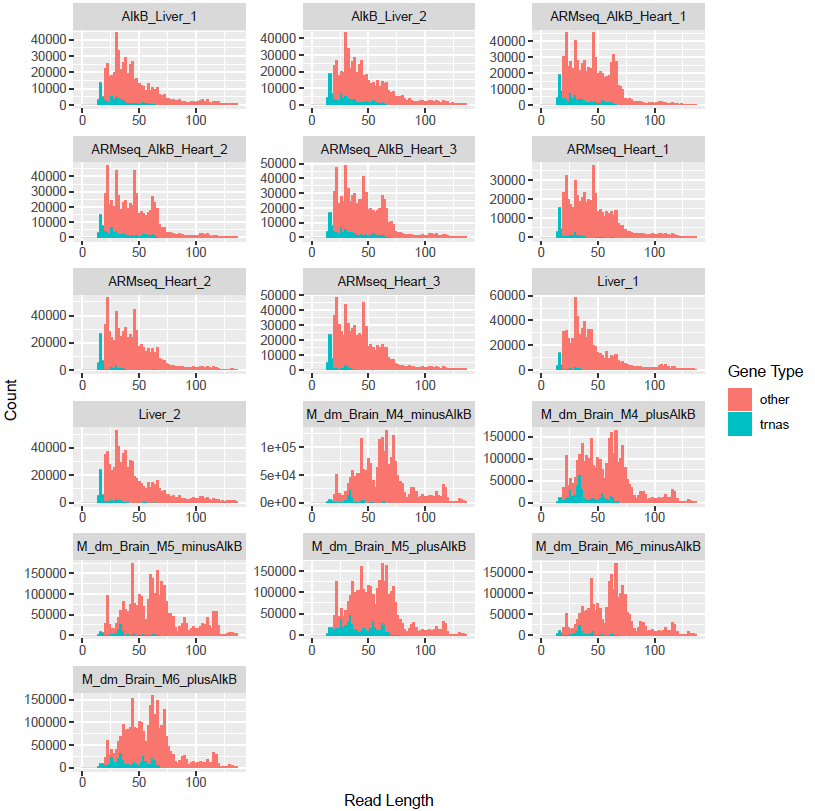
In addition, tRAX computes the breakdown of reads by length and presents it in <experiment name>-readlengths.pdf (below). If the read lengths do not represnt general sequence lengths of tRNAs, tDRs, or other genes of interest, it may suggest that enrichment method may be needed during sequencing libary preparation.
Abundance of tRNA, tDRs, and other genes
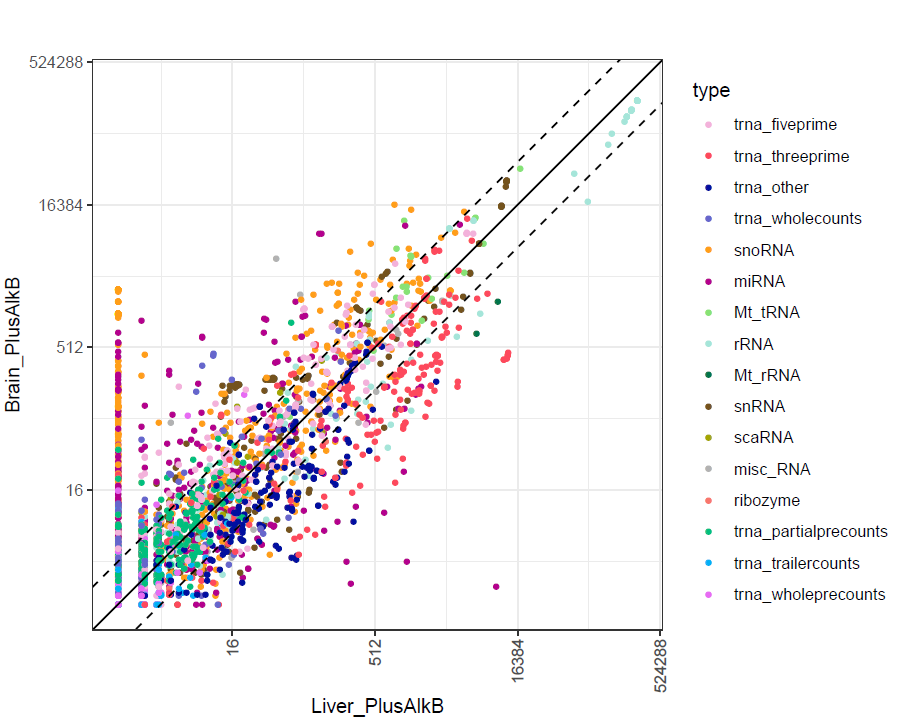
The transcript abundance in each sample replicate is presented as normalized read counts and can be found in <experiment name>-normalizedreadcounts.txt. The raw read counts are also included in <experiment name>-readcounts.txt for users who would like to perform other downstream analysis. To explore the abundance of each tRNA isodecoder, associated tDRs, and other annotated non-coding RNAs, tRAX provides scatter plots and coverage plots in addition to the read count fiiles. Based on the user-provided sample group comparison information, a set of overall scatter plots with log2 normalized read count is presented for each pair of sample groups. These plots, named as <sample1>_<sample2>-typescatter.pdf, includes abundance of all annotated genes that are grouped in different colors. The solid diagonal line represents a log2 fold change of 0 while the two dashed diagnoal lines reporesnt log2 fold change of +/-1.5. If tRNA fragment classification is enabled (as default), the abandance of the different tRNA fragment types (5', 3', and other) will also be included as shown in the example below.
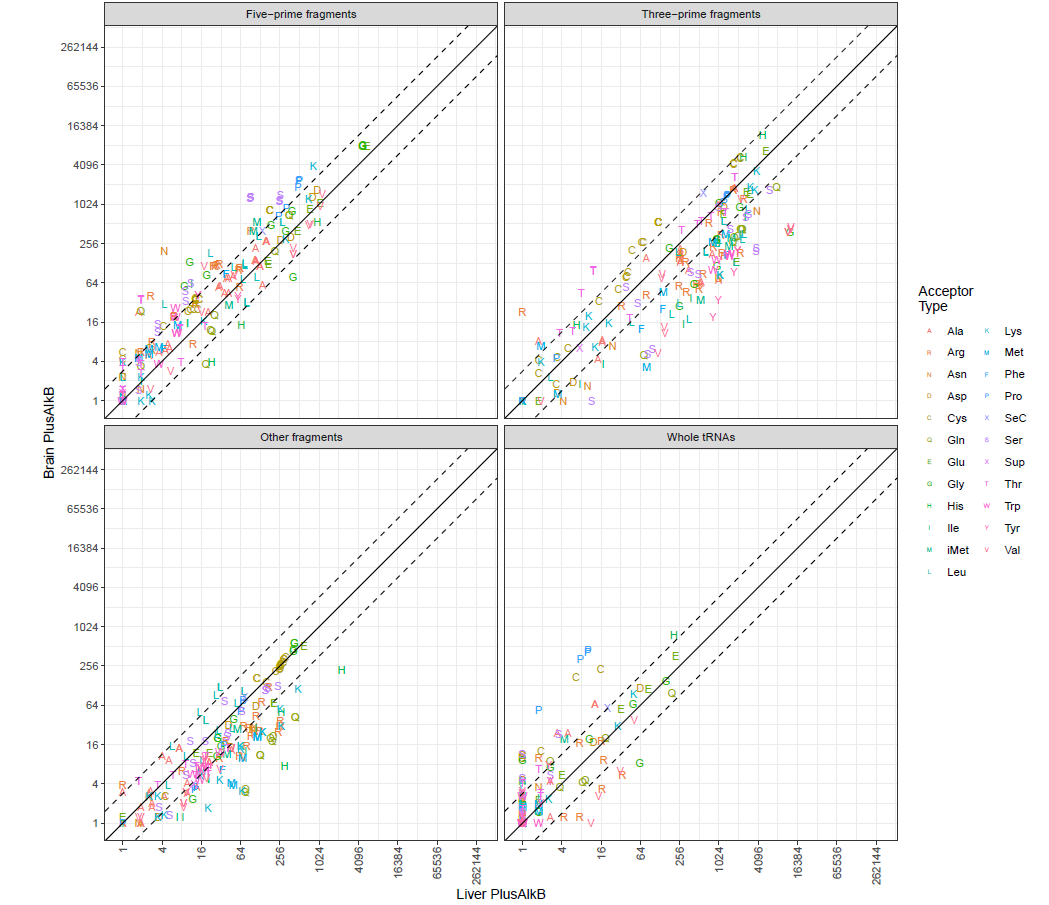
Similarly, another set of sample-pair scatter plots (<sample1>_<sample2>-aminoscatter.pdf) that only include tRNAs and tDRs is generated. The transcripts are grouped by tRNA isptypes. The abundance comparison is separated by different tRNA fragment types (5', 3', and other) in addition to the full length tRNAs (as example below). If --nofrag option is used, only the comparison of full length tRNAs will be shown.
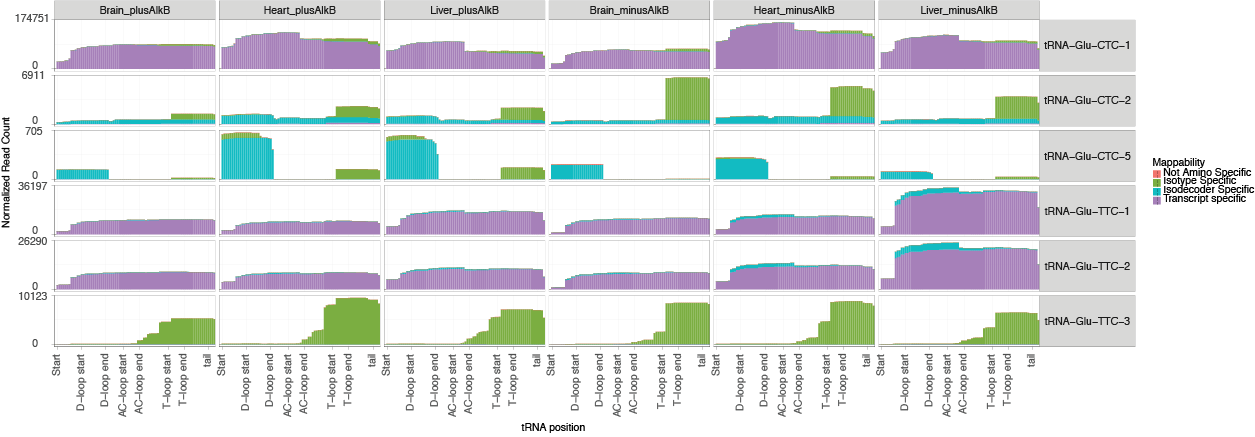
To gain a more detailed view, tRAX includes two master sets of per-base coverage plots of all individual tRNA isodecoders for all sample groups (<experiment name>-coverage.pdf and <experiment name>-pretRNAcoverage.pdf). These plots are also separated into multiple files of tRNA isotypes (<experiment name>-<isotype>_cov.pdf) for easier exploration. The example below shows the read coverage of tRNA-Glu in multiple mouse tissues. The y-axis of each plot respresents the normalized read coverage while the x-axis represents the linear Sprinzl positions of a tRNA, with the 5' end located on the left and the 3' end on the right. Colors of the coverage defines the specificity of read mapping. "Transcript specific" (purple) represents reads that uniquely map to the corresponding tRNA transcript sequence. "Isodecoder Specific" (blue) are reads that map uniquely to the transcripts with the corresponding anticodon. "Isotype specific" (green) are reads that map only to transcripts of the corresponding tRNA isotype. "Not amino specific" are reads that map to more than one tRNA isotype. A separate set of read coverage plots (<experiment name>-<isotype>_uniqueonlycov.pdf) only includes the uniquely mapped reads for specific focus.
The coverage data for transcript reads and pre-tRNA reads are also available in tab-delimited text files <experiment name>-coverage.txt and <experiment name>-pretRNAcoverage.txt with the following columns:
| Column | Description |
|---|---|
| feature | tRNA transcript or tRNA gene to which reads are aligned |
| sample | Sample replicate |
| position | tRNA position of coverage in Sprinzl numbering |
| coverage | normalized read count that covers the specific position |
| readstarts | normalized read count that indicates 5' end of transcript at the specific position |
| readends | normalized read count that indicates 3' end of transcript at the specific position |
| uniquecoverage | normalized read count with reads that are uniquely mapped to feature at the specific position |
| multitrnacoverage | normalized read count with reads that are mapped to tRNAs with specific anticodon at the specific position |
| multianticodoncoverage | normalized read count with reads that are mapped to tRNAs of the specific isotype at the specific position |
| multiaminocoverage | normalized read count with reads that are mapped to more than one tRNA isptypes at the specific position |
| tRNAreadstotal | total normalized read count of specific tRNA |
| actualbase | the reference base at specific position |
| mismatchedbases | normalized read count that does not match the reference base at specific position |
| adenines | Number of reads that map to the specific position with an adenine |
| thymines | Number of reads that map to the specific position with a thymine |
| cytosines | Number of reads that map to the specific position with a cytosine |
| guanines | Number of reads that map to the specific position with a guanine |
| deletions | Number of reads that have a gap at the specific position |
Differential expression comparison
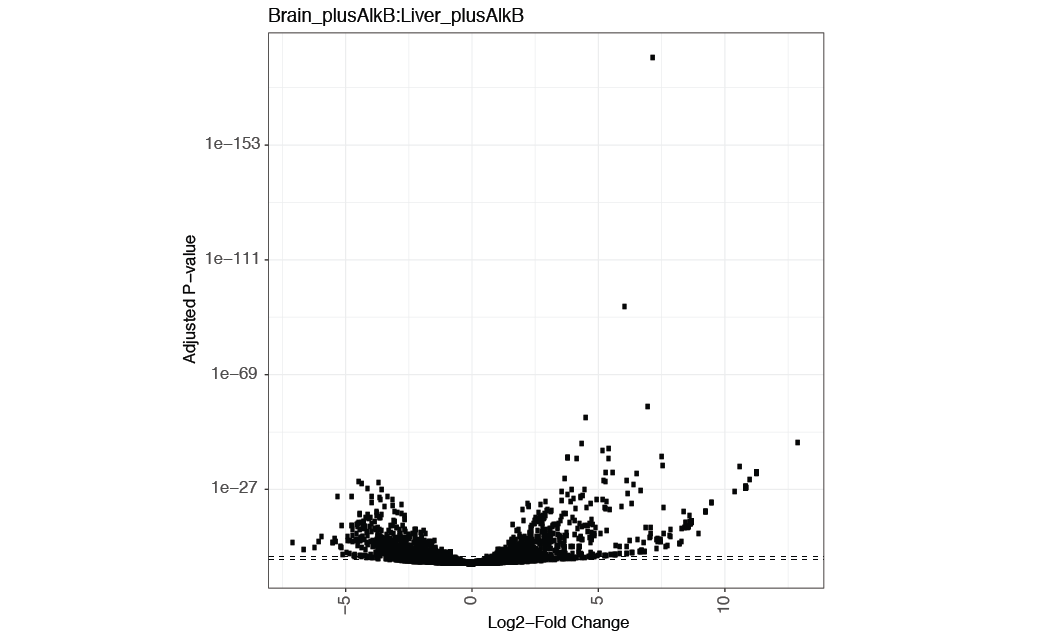
tRAX uses DESeq2 to perform differential expression analysis between pairs of sample groups specified by users. If the pair comparison is not provided, all vs all pairwise comparison will be performed. Log2 fold change values and adjusted P-values of all annotated transcripts and genes are included in tab-delimited files <experiment name>-logvals.txt and <experiment name>-padjs.txt respectively. In addition, a master file <experiment name>-combine.txt is generated with log2 fold change values, adjusted P-values, and normalized read counts of each sample group. Researchers can also assess the comparison results through volcano plots of log2 fold change values vs adjusted P-values (<sample1>_<sample2>-volcano.pdf) as the example shown below.
Sometimes, transcript abundance in sample replicates do not highly correlate that may result in low amount of significantly differentially expressed genes. To evaluate the overall correlation between sample replicates and sample groups, tRAX provides plots representing the first vs second dimensions of principle component analysis using normalized read counts. The example below shows the analysis of all the annotated genes (<experiment name>-pca.txt). A different plot (<experiment name>-pcatrna.txt) that only includes tRNAs is also provided.
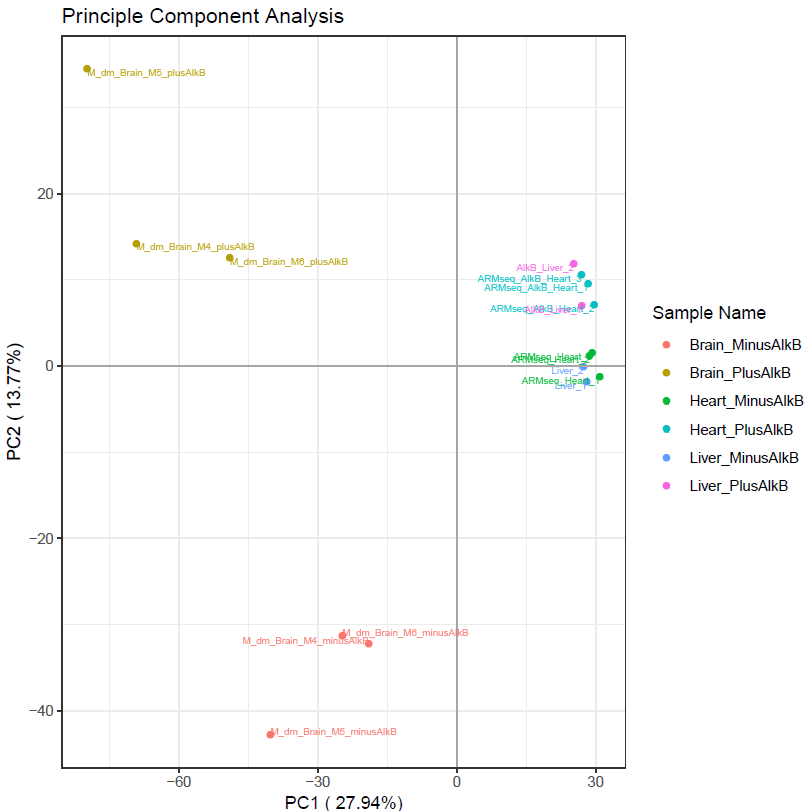
This shows the first two principle components of all the samples in the sample file. If replicates or similar samples do not cluster together, then there could be a problem with downstream analysis.
Base mismatch estimation
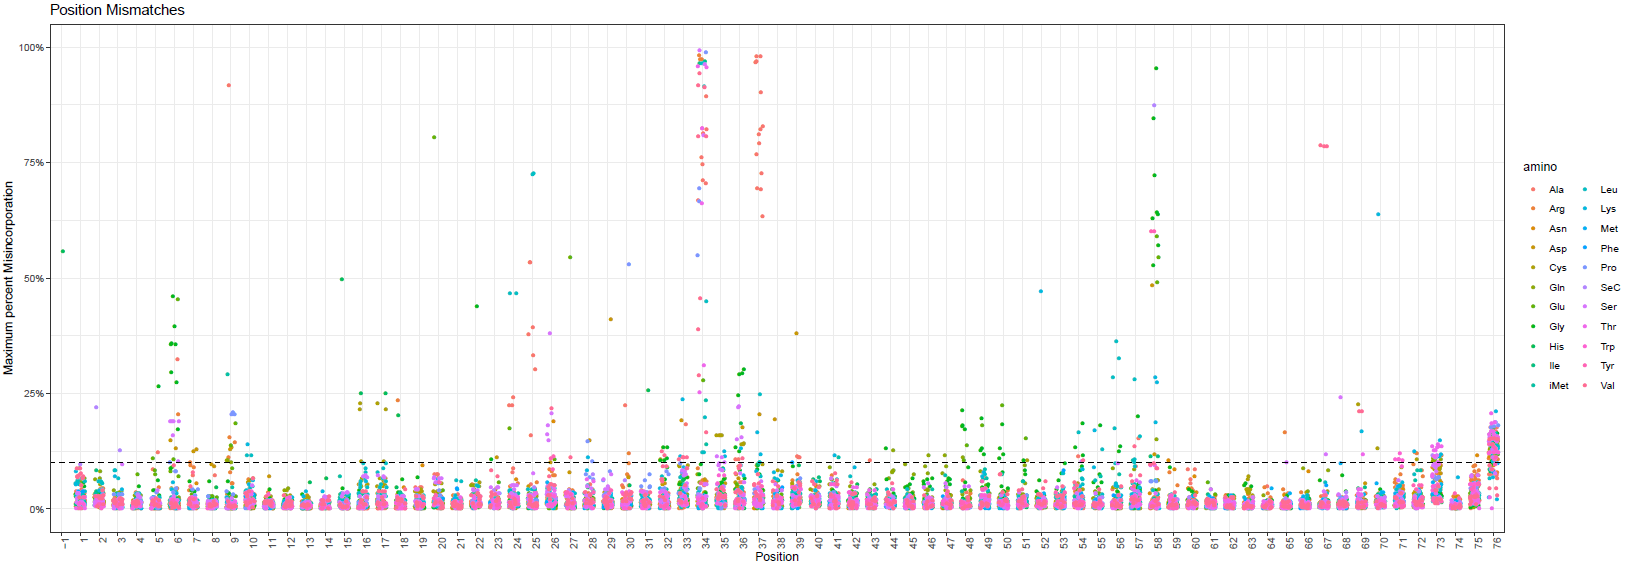
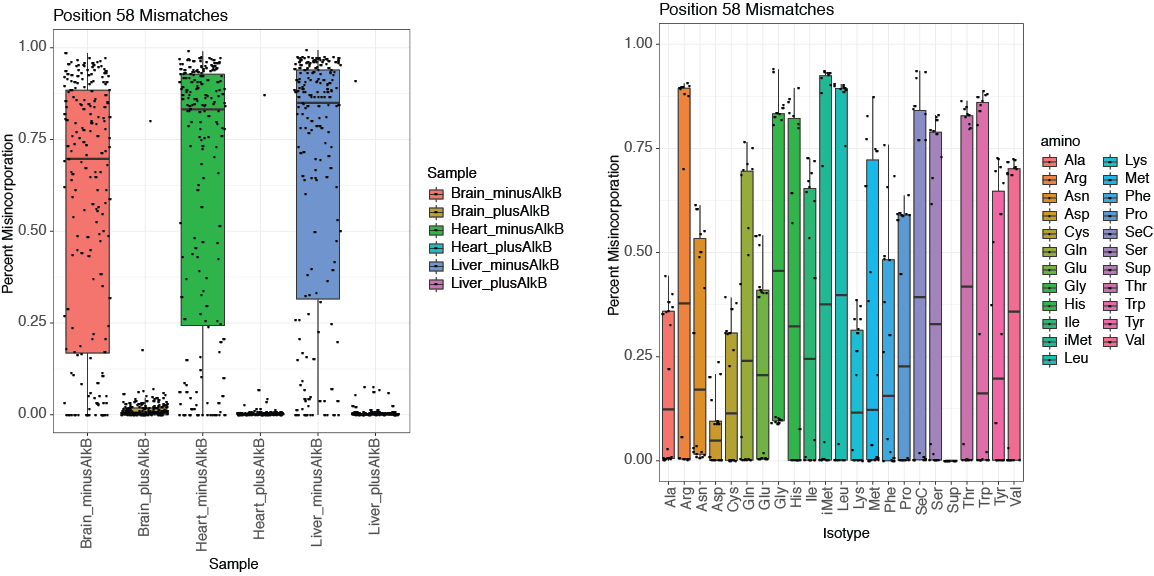
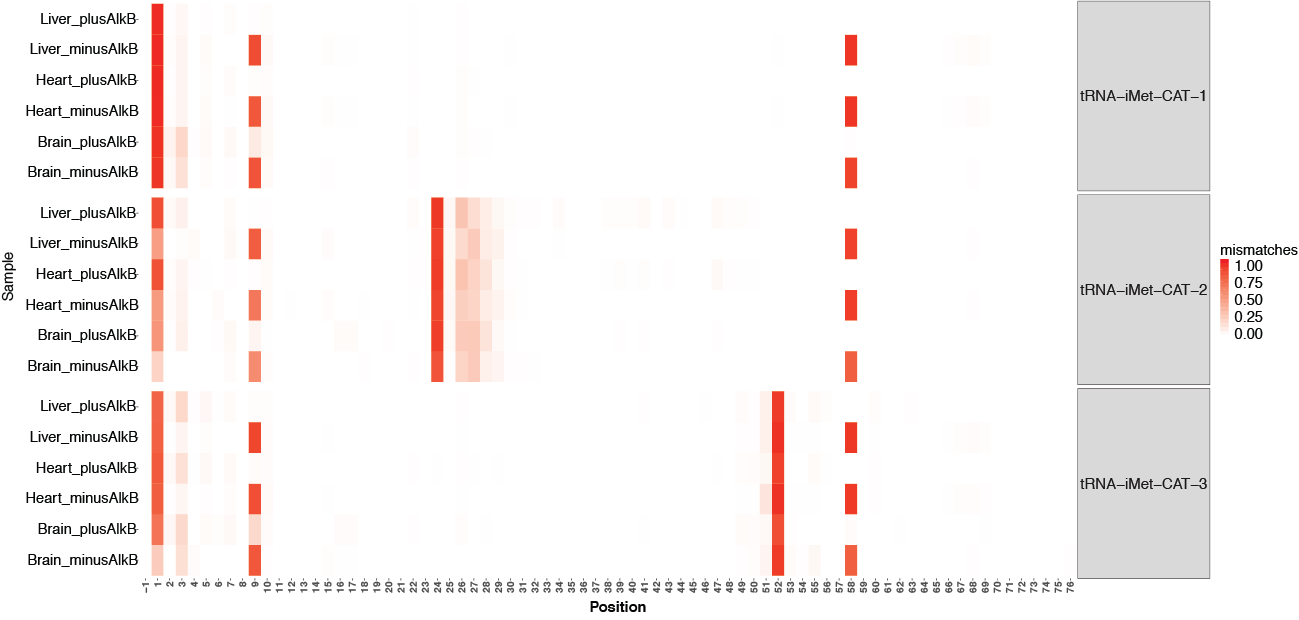
To explore the detected mis-corporations for identification of putative RNA modifications, tRAX generates a series of graphical plots including overall maximum per-base mismatch frequencies among all samples (<experiment name>-trnapositionmismatches.pdf) (top figure below), per-base mismatch frequencies in each tRNA isodecoder (<experiment name>-<isotype>_mismatch.pdf) (second figure below), dot plot comparison across samples and tRNA isotypes for each tRNA position (<experiment name>-<position>-possamplemismatches.pdf and <experiment name>-<position>-posaminomismatches.pdf) (figures on the third row below), along with heatmaps of mismatch frequencies that are broken down by tRNA isotype (<experiment name>-<isotype>_mismatchheatmap.pdf) (bottom below).
Genome browser tracks
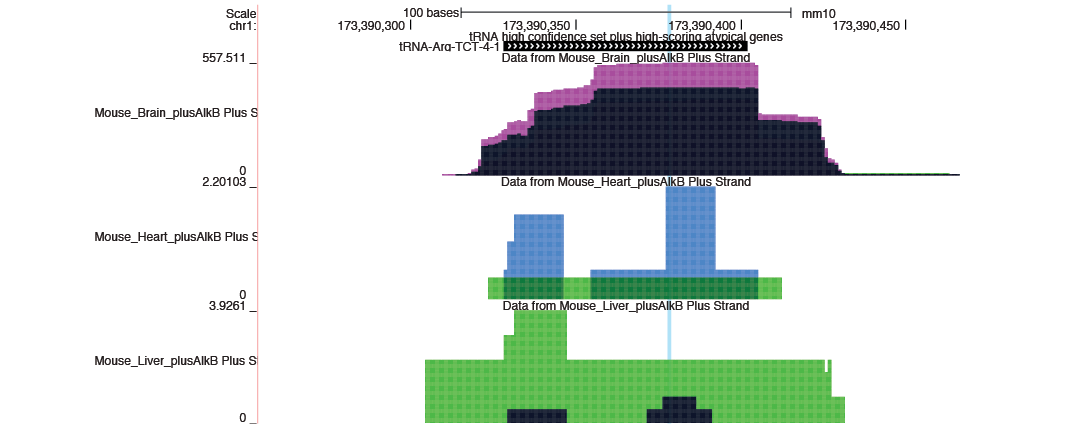
To allow researchers to easily explore and compare the abundance of tRNAs and tDRs, tRAX generates strand-specific read coverage data tracks for each sample replicate (<sample>.Plus.bw and <sample>.Minus.bw) to be used in UCSC Genome Browser or other supported genome browsers. UCSC Genome Browser track information in track database definition format is also provided to be included in a track hub. The example below shows the read coverage of tRNA-Arg-TCT-4-1 in mouse brain, heart, and liver. Please note that each coverage track has a different scale by default and can be configured through the track settings.